State of Arizona housing: Here’s a look at the numbers

Most Arizona counties had an increase in the number of housing units between 2010 and 2020. The counties with the most substantial growth in housing were Maricopa (10.6%), Yavapai (9.7%), Coconino (9.1%), and Pinal (8.6%), all of which grew at a faster rate than the nation. The U.S. had an increase of 6.7% in housing units during this time. There were five counties in the state with fewer housing units in 2020 than they had in 2010. These were La Paz (-16.2%), Apache (-11.7%), Navajo (-1.3%), and Cochise (-0.7%). Exhibit 1 displays the counties in Arizona, their housing units in 2020, and the % change over the decade.
Interestingly, Maricopa County had the fourth largest total number of housing units in the nation in 2020, behind Harris, TX; Cook, IL; and Los Angeles, CA. There were 1,812,827 housing units in Maricopa County in 2020, an increase of more than 10 percent from 2010.
Exhibit 1: Number of Housing Units in Arizona Counties for 2020 and Percent Change from 2010
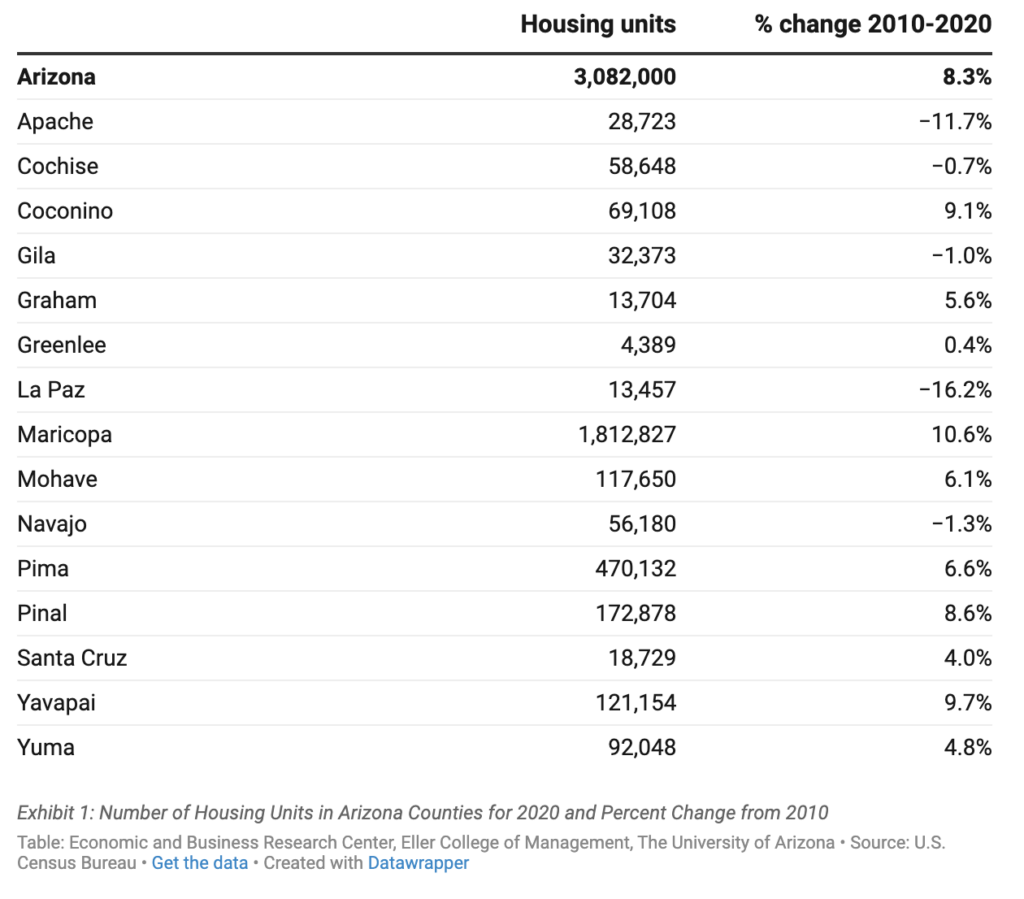
Arizona was among the top third of states with an 8.3% increase in growth in housing units over the decade. The District of Columbia topped all states with an increase of 18.1%, while the state growing the most was Utah at 17.5%, followed by North Dakota at 16.7%.
Let’s turn to occupied housing units. Housing tenure is characterized by occupancy status: ownership with a mortgage or loan, owned free and clear, or renter occupied. Around a third of the housing in the nation is renter-occupied. In Arizona, the percentage of rented housing units ranges from 20.4% in Pinal to 55.7% in Greenlee. Households owned by the occupants usually have a mortgage or a loan. There were, however, five counties where the number of houses owned outright without a mortgage or loan was larger than the number with mortgages. These were Apache, Gila, Greenlee, La Paz, and Navajo.
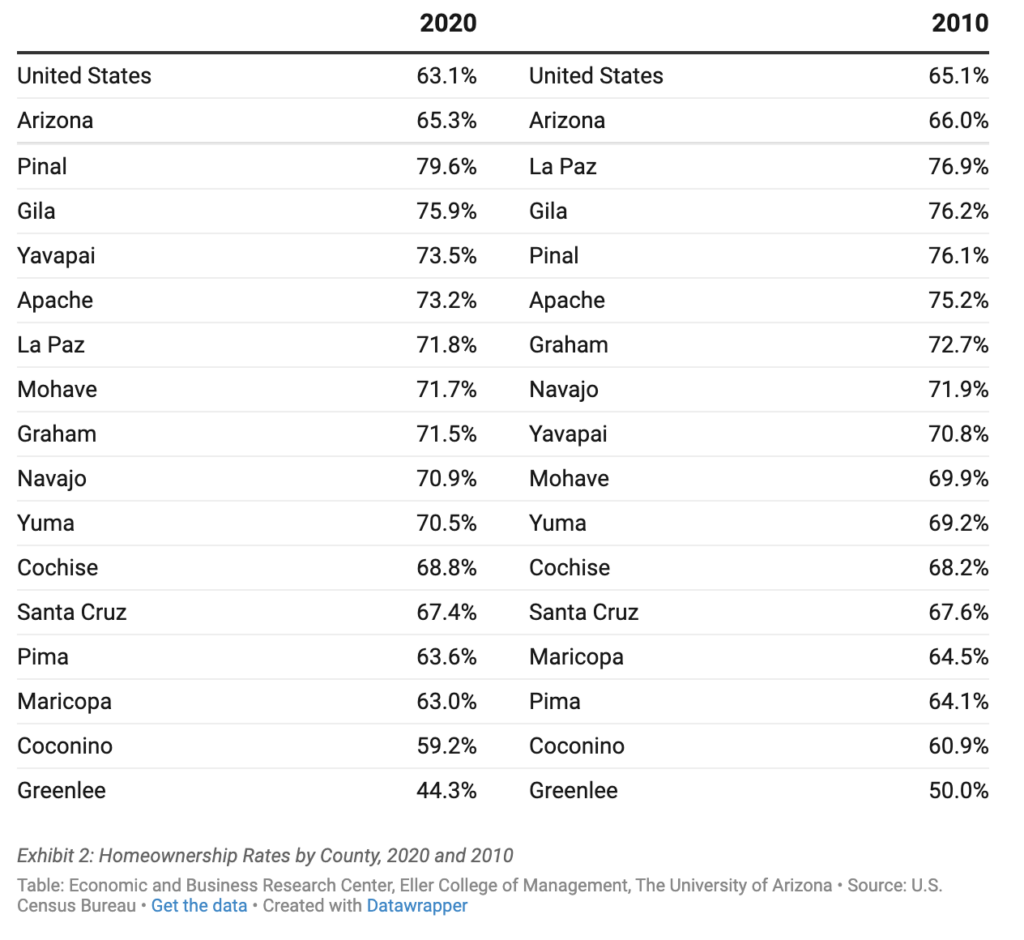
The homeownership rate is the proportion of households that are owner-occupied (either with a mortgage or owned free and clear). The homeownership rate for Arizona in 2020 was 65.3%, a bit higher than the nation at 63.1%. Homeownership was highest in Pinal County, with a rate of 79.6%, followed by Gila at 75.9% and Yavapai at 73.5%. Three Arizona counties had a homeownership rate lower than the nation in 2020 – Maricopa at 63.0%, Coconino at 59.2%, and Greenlee at 44.3%.
Homeownership declined over the decade for the nation, as well as most areas in Arizona. Two counties in the state had a marked increase in homeownership between 2010 and 2020: Pinal, moving up 3.5 percentage points, and Yavapai, moving up 2.7 percentage points. La Paz and Greenlee had the most substantial decreases in homeownership over the decade. La Paz County had the highest rate in 2010, but was far from the highest in 2020 as Pinal rose to the top, surpassing both La Paz and Gila. Exhibit 2 ranks homeownership in Arizona counties for 2010 and 2020.
Exhibit 2: Homeownership Rates by County, 2020 and 2010
Categories
Recent Posts